Challenges
- Responding to climate change risks and opportunities (TCFD)
- Reducing greenhouse gas emissions
Relevant stakeholders
Direct: Local communities, the environment, customers
Indirect: Shareholders and investors, creditors, NGOs/NPOs, industry groups
Our policy
Climate change has begun to cause frequent extreme weather events and natural disasters in recent years, such as heavy rainfall and flooding. We acknowledge that it is increasing the risks faced by our Group, including impacts on the growth of trees providing the natural rubber used to make tires, impacts on plant operations, and disruptions in the supply chain.
We also recognize that our Group's efforts to reduce CO2 and other greenhouse gas (GHG) emissions within its business are essential in working toward achieving both the Paris Agreement goal of limiting average temperature increases to below 2°C, and carbon neutrality in Japan.
As the impact of climate change intensifies, increasing social demands are being made towards mobility. We see the mobility business as the heart of our Group, and recognize that responding to climate change is the most key issue decisive to our growth. Our responsibility to both current and future generations is to reduce our greenhouse gas (GHG) emissions to help achieve the long-term targets set by the Paris Agreement and we are aiming to be carbon neutral by 2050.
With all this in mind, the Group has declared our support for the TCFD recommendations, and will report information covering governance, strategy, risk management, and metrics and targets in accordance with the TCFD framework in order to activate stakeholder dialogue and promote climate change-related initiatives that help work toward a more sustainable world.
The Group supports laws and regulations (such as the Act on Promotion of Global Warming Countermeasures, and the Act on Rationalizing Energy Use) as well as policies related to climate change and reduced energy use, and is taking appropriate steps to comply with them at our sites both in Japan and overseas.
Responsible executive (as of April 2025)
Senior Corporate Officer and Vice President of Quality Assurance, Environment & Safety Headquarters
Organizational responsibilities (as of April 2025)
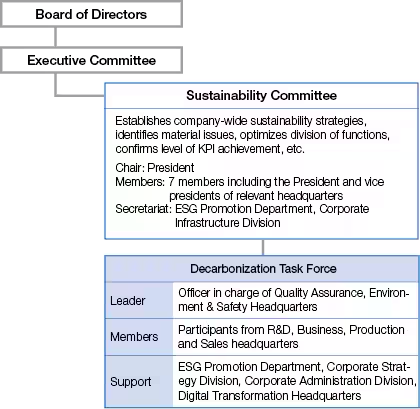
The Toyo Tire Sustainability Committee is chaired by the president and meets four times a year. The committee reports, deliberates and makes decisions on how to respond to climate-related and other sustainability issues, and what progress is being made. The Decarbonization Task Force, which sits under the Sustainability Committee, discusses climate-related activity plans, targets and KPIs, and the Sustainability Committee regularly confirms and monitors the status of those activities. Any climate-related matters that have been reported and debated in the Sustainability Committee are then reported to or debated in the Executive Committee and reflected in the formulation or review of our annual and medium-term business plans. The developments are reported to the Board of Directors in a timely and appropriate fashion.
Reporting systems
- Reporting hotline (whistle-blowing system): For executives, employees and suppliers
- Customer Relations Department: For customers (consumers) and local communities
- Online inquiry form: For customers (consumers), shareholders and investors, and NGOs/NPOs
Main resources for promoting activities (2024)
Costs of climate change adaptation and mitigation in main business area: 1,593 million yen
Responding to climate change risks and opportunities (TCFD)
Strategy
We have performed a scenario analysis of the impact climate change could potentially have on Group corporate activities.
- ① Select scenarios to use and understand the outlook of each scenario
- ② Investigate risks and opportunities in each scenario
- ③ Assess the significance of risks and opportunities, identify those of high significance and organize measures against risks
- ④ Calculate the financial impact of risks expected to have a large medium- to long-term impact and explore possible countermeasures

① Select scenarios to use and understand the outlook of each scenario
In our analysis, we evaluated the impact of climate-related risks and opportunities in a baseline scenario (3-4°C scenario) and a transition scenario (1.5°C scenario).
In the baseline scenario we focused on physical risks, and explored transition risks in the transition scenario.
| Baseline scenario | Transition scenario | |
|---|---|---|
| Summary | No additional measures are taken to limit the rise of emissions, and average temperatures rise by up to 3-4°C within the 21st century | Decarbonization efforts advance in order to limit the average temperature rise to below 1.5°C during the 21st century |
| Scenario outlook |
|
|
| Primary scenarios referenced |
|
|
② Investigate risks and opportunities in each scenario
③ Assess the significance of risks and opportunities, identify those of high significance and establish measures against risks
We identified climate-related risks and opportunities for each scenario and evaluated the significance of risks and opportunities based on the probability of certain events occurring that could prove to be pertinent factors in each risk and opportunity and the degree of impact on the expected costs and other factors in our business. We also established measures against risks of high significance.
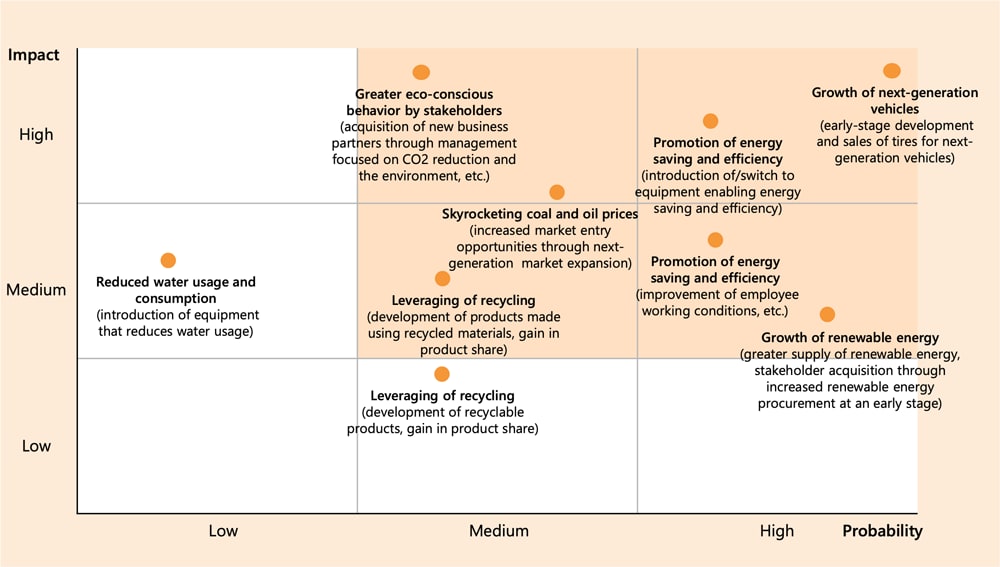
Risk and Opportunity (medium-term) significance assessment of each scenario
Baseline scenario: Risk (medium-term) significance assessment
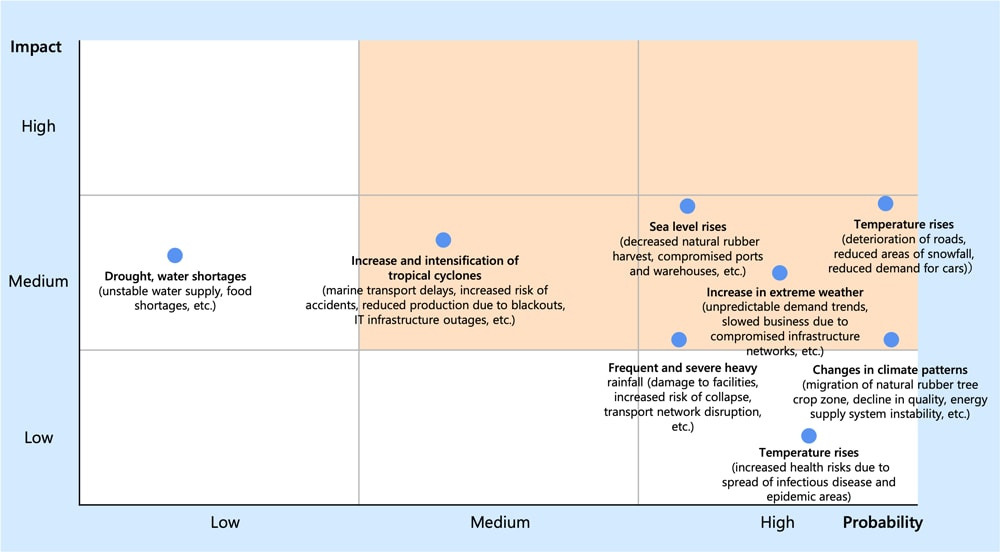 (Click to enlarge)
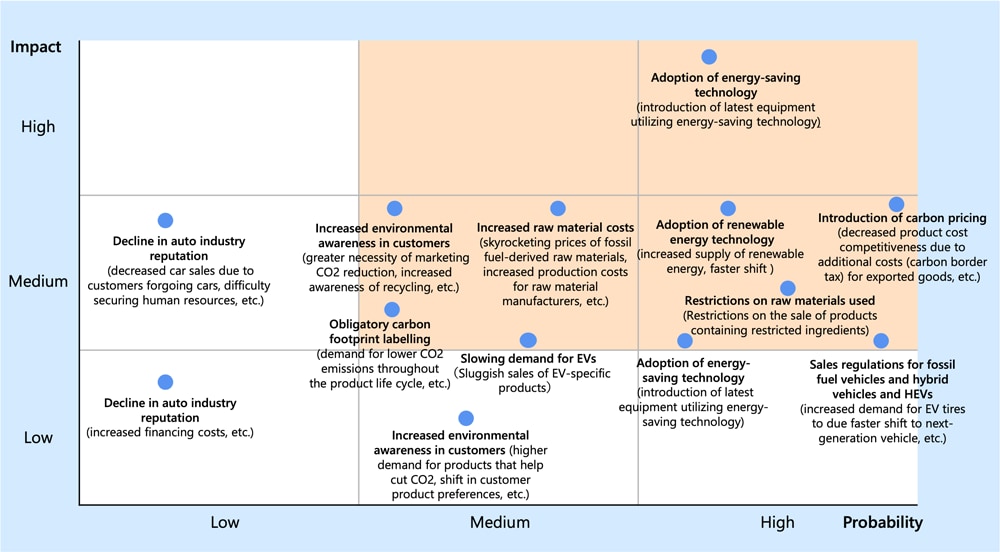
Transition scenario: Risk (medium-term) significance assessment
 (Click to enlarge)
Baseline scenario: Opportunity (medium-term) significance assessment
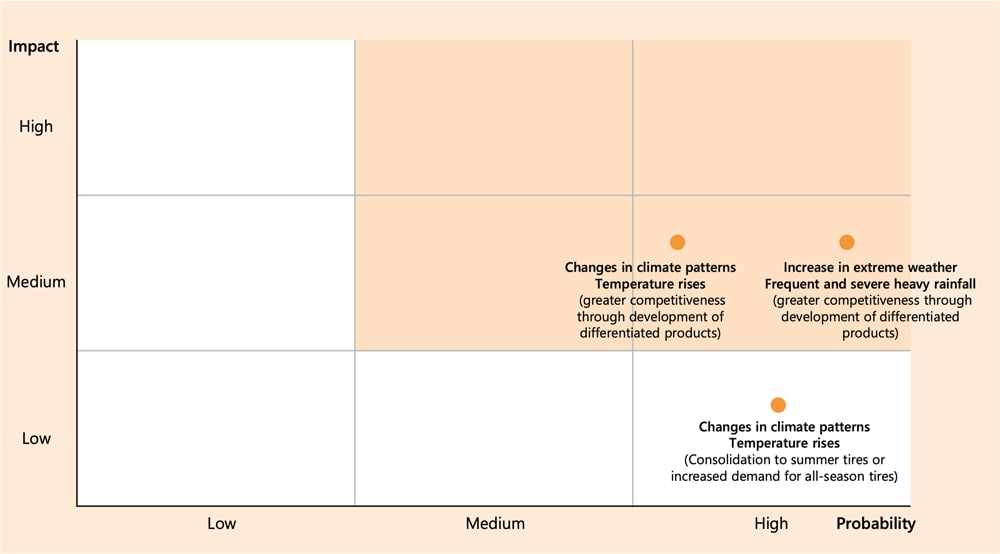 (Click to enlarge)
Transition scenario: Opportunity (medium-term) significance assessment
 (Click to enlarge)
Risks and opportunities of medium impact or higher
Click here for a list of risks and opportunities of medium impact or higher
Highly significant risks and opportunities
<Risk>
| Scenario | Type | Climate-related events | Impact on business | Main financial impact | Measures against risks |
|---|---|---|---|---|---|
| Baseline | Chronic | Changes in climate patterns |
|
|
(i) |
|
(ii) | ||||
|
(iii) | ||||
|
|||||
| Temperature rises |
|
|
(ii) | ||
|
(iv) | ||||
| Sea level rises |
|
|
(i) | ||
|
(iii) | ||||
|
|||||
| Acute | Increase in extreme whether Frequent and Severe heavy rainfall and tropical cyclones |
|
|
(v) | |
|
|||||
|
|||||
|
|||||
| Transition | Policy | Introduction of carbon pricing |
|
|
(iii) |
|
(ii) | ||||
|
(vi) | ||||
|
|||||
| Market/Reputation | Increase raw material costs |
|
|
(i) |
Measures against risks
| (i) | Develop technologies that reduce tire weight to minimize raw material usage (Material issue 1, 2) |
| (ii) | Develop high efficiency, high precision tires using NANO BALANCE TECHNOLOGY and T-MODE to reduce R&D costs (Material issue 1, 2) |
| (iii) | Strengthen supply capacity at production bases in Europe and the United States to create an agile and optimized global supply system and lessen the impact of reduced production and rapidly rising distribution costs (Medium-Term '21 Plan Growth Strategy: Production and Supply) |
| (iv) | Expand entry into next-generation vehicle tire market (Material issue 5: Climate change-related (TCFD) opportunities) |
| (v) | Minimize damage and loss and restore operations promptly using business continuity plans (Enterprise risk management) |
| (vi) | Promote GHG emission reduction throughout the supply chain as part of obtaining SBTi certification (Material issue 5) |
<Opportunities>
| Scenario | Type | Climate-related events | Impact on business | Main financial impact |
|---|---|---|---|---|
| Baseline | Chronic | Changes in climate patterns Increase in extreme weather |
|
|
| Transition | Market | Greater eco-conscious behavior by stakeholders |
|
|
| Products/ services | Growth of next-generation vehicles |
|
||
| Energy | Skyrocketing fossil fuel |
|
④ Calculate the financial impact of risks expected to have a large medium- to long-term impact and explore possible countermeasures
1.Impact of changes in climate patterns on the procurement of natural rubber (risk)
| Type | Climate-related event/financial impact on business | Impact cost/year impacted | Calculation method | Countermeasures |
|---|---|---|---|---|
| Chronic | Changing climate patterns will generate changes in the areas in which natural rubber plants can grow, a deterioration in quality and other issues, all of which could increase the cost of natural rubber procurement | Approx. 0.7 to 9.7 billion yen (Medium-term: 2030) |
(Minimum) Volume of natural rubber procurement × Increase in natural rubber prices
Increase in natural rubber procurement cost × Percentage increase in natural rubber procurement volume
|
|
2.Impact of carbon pricing mechanism(risk)
| Type | Climate-related event/financial impact on business | Impact cost/year impacted | Calculation method | Response measures |
|---|---|---|---|---|
| Policy | Introducing a carbon pricing mechanism results in a rise in the cost of emitting CO2. | Approx. 0.5 billion yen (Medium-term: 2030) |
Shortfall in CO2 reduction target × Carbon tax
|
|
| Approx. 5.7 billion yen (Medium-term: 2030) |
CO2 emissions × Carbon tax
|
Risk management
Identification and assessment of climate-related risks is carried out primarily by the Corporate Administration Division, which leads TCFD response, the Corporate Infrastructure Division's ESG Promotion Department, which oversees the Sustainability Committee, and the Environment & Safety Division's Environment & Health Department, which manages the Decarbonization Task Force. After assessment, they are deliberated by the Sustainability Committee to evaluate company-wide climate-related risks.
Through the Sustainability Committee's Decarbonization Task Force, we closely monitor the regulatory requirements in each country-such as GHG emissions reduction targets (including renewable energy targets), vehicle fuel efficiency regulations, and bans on sales of new gasoline-powered vehicles-and encourage the relevant departments to address each risk and manage progress.
Metrics and targets
Climate-related metrics
- GHG emissions (Scope 1, Scope2, Scope3)
See the results from 2019-2024 here. - GHG emissions intensity
See the results from 2019-2024 here. - Introduction of an internal carbon pricing system
Used to evaluate decarbonization-related projects and other investment initiatives. Following a trial operation in fiscal 2023, the system was officially launched in fiscal 2024. As of April 2025, the carbon price* is set at 10,000 yen/ton.
* The appropriateness of the carbon price will be assessed each year and revised if necessary.
Climate-related targets
GHG emissions reduction targets
* Decided by the Sustainability Committee in November 2021 and approved by the Executive Committee in December 2021. * Announced on February 15, 2022.
| Scope1,Scope2 | GHG emissions: Reduce GHG emission by 46% by 2030 compared to 2019 and aim to achieve carbon neutrality by 2050. |
| Scope3 | GHG emission per unit: Aim to help reduce GHG emissions per tire in 2030 by 20% compared to 2019. |
*One of our milestones is to aim to reduce Scope 1 & Scope2 GHG emissions by 25% by 2025 compared to fiscal 2019
Continuing to align with TCFD
To continue incorporating the TCFD recommendations, in the future we will further refine our scenario analysis to gain a greater understanding of the quantitative impacts of risks and opportunities, and to investigate, devise and enact strategies in response.
We will also follow the TCFD recommendations when providing our stakeholders with timely disclosures.
Reducing GHG emissions
Reducing energy consumption
To help mitigate climate change, the Toyo Tire Group is striving to reduce energy consumption through effective usage of the energy required for corporate activities both in and outside the organization. We are also developing new products and technologies that contribute to climate change mitigation and adaptation.
See the results from 2020-2024 hereEnergy consumption (during logistics)
See the results from 2020-2024 hereEnergy intensity
See the results from 2020-2024 hereExamples of reducing energy consumption
- Reinforcing heat insulation on pipes to reduce heat loss
- Applying radiative cooling paint to buildings to reduce cooling load
- Reusing waste heat from drains and upgrading to high-efficiency equipment to increase energy efficiency
At the Sendai Plant, since October 2024 we have been using steam ejectors to absorb flash steam from steam drains that is generated in the vulcanization process and pressurize it for reuse. This has resulted in an annualized CO2 emissions reduction of 787 tons.
Reducing the energy requirements of products (fuel-efficient tires)
See the results from 2020-2024 hereReducing greenhouse gas emissions
Greenhouse gas emissions are seen as a major cause of climate change so the Toyo Tire Group is working to reduce GHG emissions through its products and business activities inside and outside the organization.
While energy consumption inevitably increases with production volume, we are striving to reduce Scope 1 and Scope 2 emissions with a number of initiatives. To reduce heat loss, we are reinforcing the heat insulation of steam pipes and other equipment to prevent heat dissipation. At the same time, to reduce load on cooling and other equipment, we are applying radiative cooling paint to the roof and exterior walls of buildings to prevent heat from entering. We are also improving energy efficiency and using waste heat more efficiently by upgrading equipment to highly efficient energy-saving models and using steam ejectors to absorb and pressurize flash steam in steam drains for reuse. In efforts to shift to more sustainable fuel sources, we have been promoting renewable energy use and converting forklifts to electric power. In 2024, we converted 13 forklifts and achieved an annualized CO2 emissions reduction of approximately 400 tons. Our initiative to convert boilers to gas fuel with fewer GHG emissions has been completed at all bases in Japan aside from those where extensive gas infrastructure still needs to be built.
The Toyo Tire Group aims to contribute to a 20% reduction in Scope 3 GHG emissions per tire by 2030 compared to 2019. A calculation of GHG emissions throughout the Group's value chain based on the Japan Automobile Tyre Manufacturers Association's (JATMA) Tyre LCCO2 Calculation Guidelines Ver. 3.0.1 revealed that emissions from the Category 11 product use phase account for at least 80% of overall GHG emitted. According to the guidelines, fuel-efficient tires can reduce CO2 emissions during use (during vehicle driving) by 95.4 kg CO2e per tire for passenger car radial (PCR) and 879.0 kg CO2e per tire for truck and bus radial (TBR) compared to standard tires. Our technical division is working to develop technologies to enhance fuel efficiency of tires by reducing their rolling resistance and weight. Over the medium to long term, the Group is planning to enlist the help of the Product Planning Division in upgrading fuel efficiency performance each time we change a tire model. As of 2024, emissions from PCR had been reduced by 2.2% compared to 2019, which is a reduction of 140 thousand tons-CO2e.
GHG emissions
See the results from 2019-2024 here.GHG emissions intensity
See the results from 2019-2024 here.Third-party assurance:
To ensure the accuracy and reliability of the data that we disclose, we have obtained the assurance of a third-party organization for our fiscal 2024 environmental data.
- Verification of scope: Total Scope 1 energy-derived CO2 emissions, total Scope 1 CH4 and N2O energy-derived emissions, total Scope 2 emissions, Scope 3 Categories 1, 11 and 12, total water intake, breakdown of water intake, total water discharge and breakdown of water discharge at 114 sites* of Toyo Tire Corporation and its affiliated companies
- Verification period: January 2024 to December 2024
- Verification criteria: ISO14064-3: 2006, related laws and regulations, and the assurance organization's protocol
- Third-party assurance organization: SGS Japan Inc.
* Toyo Tire Corporation (Headquarters, Sendai Plant, Kuwana Plants (tire and automotive parts), Hyogo Manufacturing Complex, Corporate Technology Center, Tire Technical Center, Automotive Parts Technical Center, Miyazaki Tire Proving Ground, Saroma Tire Proving Ground, Tokyo Office, Hiroshima Office, Kanto Distribution Center, Kansai Distribution Center); Fukushima Rubber Co., Ltd.; Ayabe Toyo Rubber Co., Ltd.; Orient Machinery Co., Ltd. (Headquarters, Sendai branch, Rokko branch); Toyo Tire Japan Co., Ltd. (88 sites); Toyo Tire North America Manufacturing Inc.; Toyo Automotive Parts (Guangzhou) Co., Ltd.; Toyo Tire (Zhangjiagang) Co., Ltd.; Toyo Tire (Zhangjiagang) Co., Ltd.; Toyo Tyre Malaysia Sdn. Bhd.; Toyo Rubber Chemical Products (Thailand) Limited; Toyo Tire Serbia D.O.O
Please click here to read more about verification statement.Increasing use of clean energy
From the second half of 2022, the Toyo Tire Group began switching electricity purchased primarily at production sites to power derived from renewable sources. We will systematically promote efforts to achieve a global 90% renewable energy usage ratio by 2030. That ratio stood at 85.5% on a purchased electricity basis at the end of 2024. We are also actively introducing photovoltaic (PV) power generation systems for in-house use. We are also actively introducing photovoltaic (PV) power generation systems for in-house use.
At our Serbia Factory that opened in 2022, we have installed 30 photovoltaic (PV) power generation systems with a total capacity of 8.4 MW - the largest in the country. This generates 10,150 MWh of electricity annually and contributes to a 7,100-ton reduction in CO2 emissions.
At our tire plant in Malaysia, in 2024 we once again expanded the PV power generation system that went into operation at the end of 2023. The 96,000 square-meter rooftop system is now in full operation with a generation capacity of 15.8 MW (up from 14.0 MW at the end of 2023). It is expected to generate 21,000 MWh and reduce CO2 emissions by approximately 13,000 tons per year. At our Corporate Technology Center in Japan, at the end of 2023 we installed what is the country's largest PV power generation system, with an annual generation capacity of approximately 419 MWh. The system is expected to supply approximately 12% of the center's electricity needs, and reduce CO2 emissions by approximately 128 tons per year.
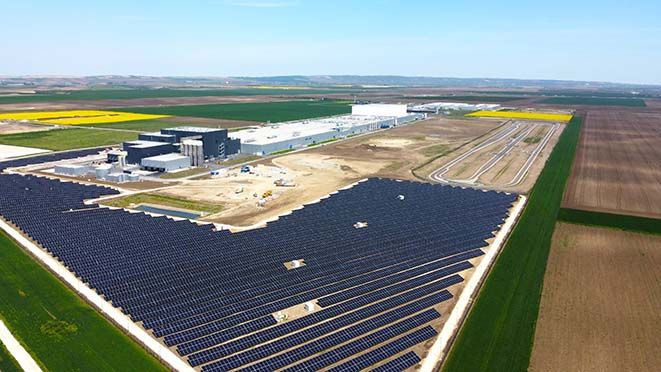
Photovoltaic power generation system installed at our tire plant in Serbia
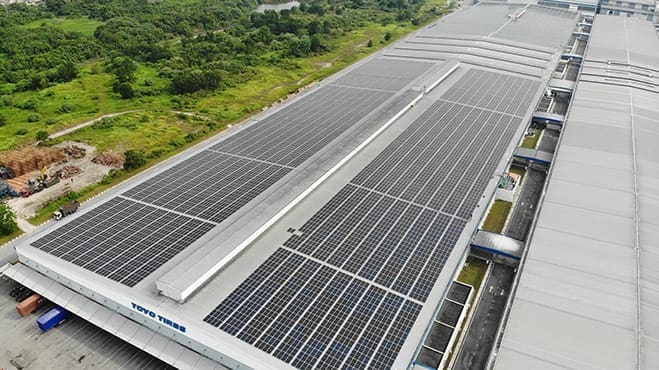
Our Malaysia factory
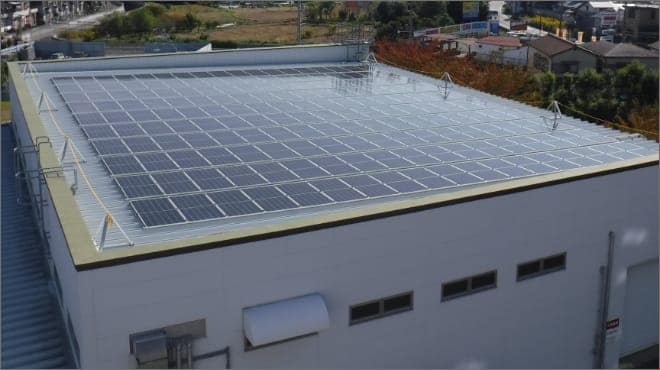
Solar panels introduced at Corporate Technology Center
SBTi*1initiatives
In November 2024, Toyo Tire Corporation received SBT certification from the Science Based Targets Initiative (SBTi) for its GHG emissions reduction targets set for 2030, which are based on scientific evidence to limit global warming to within 1.5ºC.
We have already set targets for reducing GHG emissions as the Toyo Tire Group and are currently working to achieve them, and we will further strengthen and promote our efforts across the entire supply chain.
GHG emissions reduction targets have been certified are as follows.
| Classification | Target |
|---|---|
| Scope1,Scope2 (Emissions from our company's business activities) |
46.20% reduction in total emissions by 2030 (compared to 2019) |
| Scope3 Category 1 (Emissions from other companies in purchased products and services) |
Suppliers accounting for 89.00% of emissions related to purchased products and services will have science-based targets by 2029 (compared to 2019) |
*1 SBTi: Initiative to achieve the target of limiting global average temperatures increase to within 1.5ºC.