Response to Climate Change
- Opportunities and Risks posed by Climate Change
- Medium- to long-term CO₂ emission reduction goals
- Reduction of Energy Consumption
- Reduction of Greenhouse Gas (GHG) Emissions
Opportunities and Risks posed by Climate Change
We recognize that risks and opportunities posed by climate change are important business issues.
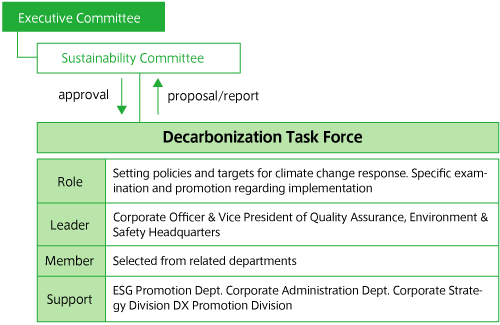
As for our response to climate change, we have established "Decarbonization Task Force" under the Sustainability Committee in July 2021, and discuss action plans, which include orientation, goals, targets, Activity plan and KPI.
The Task Force is considering countermeasures against climate change that companies should engage in while referring to the contents of the CDP* Climate Change Questionnaire and Final Report (Recommendations) of Task Force on Climate-related Financial Disclosures (TCFD)**. Based on the predicted impact of climate change published by the Intergovernmental Panel on Climate Change (IPCC) and various research institutes, we are in the process of organizing climate-related long-term opportunities, risks (physical and transition), and financial impact that will occur in continuing corporate operations.
For example, we recognize the impact of climate change as an opportunity, and receives profit from the development and sales of fuel-efficient products.
In addition, there are some countermeasures that have launched in response to the risks of the strengthen environmental regulations in each country, such as changing fuel sources and improving the energy efficiency of facilities. In future, we will prioritize these opportunities and risks that have been organized, evaluate the business impact using scenarios that are based on scientific evidence, and set long-term targets.
- * An international NGO working in environmental fields (climate change, water security and forest). Uses questionnaires to collect information related to companies’ CO2 emissions and initiatives on climate change, etc., evaluate and disclose.
- ** Established by the Financial Stability Board (FSB) in 2015 for the purpose of discussing the financial industry’s response to climate change issues.
Main opportunities and risks
| Opportunity and Risk | Climate Change Situation | Potentially Material Impact on Business |
|---|---|---|
| Opportunity | Transition to low-carbon energy/distributed energy, making use of incentives provided as policy, more efficient transportation methods, use of manufacturing and logistics processes | Reduction of operational costs (improved efficiency, reduction of fuel costs, etc.) |
| Low-carbon products, technology, development of services, substitution/diversification of resources, diversification of business activities, increased demand for products adapted for physical risks | Revenue growth due to increased demand for compatible products | |
| New market development | Revenue growth in new and emerging markets | |
| Physical Risks | Growing seriousness of extreme climate phenomena (typhoon, heavy rain) | Interruption or decrease in production capacity, employees suffering from the disaster |
| Changes in precipitation patterns and weather patterns, increase in average temperatures, rise in sea level | Decline in labor force (adverse impacts on employee health and safety, etc.) | |
| Regulatory Risks | Increased obligation to report GHG emissions, strengthening and restricting enforcement of products and services, increased litigation risk | Increased business costs (expansion in purchases of emission credit, etc.) |
| Transition to low-carbon technology, products, and services (replacing existing products), failure in transition | Increased costs for introduction of new business processes (increased manufacturing costs, purchase of renewable energy certifications, etc.) | |
| Changes in customer behavior, demands from business partners, and raw materials used | Jump in input (raw material, energy, water) and output (water disposal) prices | |
| Changes in customer preferences, decline in reputation in the industry as a whole, negative feedback from stakeholders, decline in interest | Revenue reduction due to reduction in production capability (approval of a plan to delay, obstacles in the supply chain, etc.) |
Medium- to long-term CO₂ emission reduction goals
※Approved by the Executive Committee on the proposal from Sustainability Committee in December 2021
※Announced in February in 2022
| Scope1&2 | Reduce CO₂ emissions by 46% (vs. FY2019) by 2030. Carbon neutrality by 2050. |
| Scope3 | Aim to help reduce CO₂ emissions per tire by 20% (vs. FY2019) by 2030. |
Reduction of Energy Consumption
We are moving forward with efforts to reduce energy consumption through the effective use of energy required for business activities both in and outside the organization in order to contribute to the alleviation of climate change. Efforts are also being made to develop new products and technologies that contribute to climate change alleviation and adaption.
At TOYO TIRE ZHANGJIAGANG CO., LTD. (China), for instance, they renovated their facilities to reduce power consumption at the vulcanization process, which requires the largest amount of energy within the production process. As a result, this subsidiary in China was able to slash more than 50% of its power consumption at the aforementioned process in FY2019.
According to the Japan Automobile Tyre Manufacturers Association’s Tyre LCCO2 Calculation Guidelines Ver. 3.0, it is calculated that compared to General Purpose Tires, Fuel Efficient Tires can reduce fuel consumption resulting from tires by 33.6 L/tire for PCR (Passenger Car Radial) and 294.0 L/tire for TBR (Truck and Bus Radial) per tire life.
Energy Consumption within the Organization
(1000GJ)
| 2018 | 2019 | 2020 | |
|---|---|---|---|
| Total fuel consumption | 7473.0 | 7346.1 | 6777.4 |
| By Region | |||
| Japan | 4213.8 | 3991.7 | 3594.3 |
| US | 1725.0 | 1810.0 | 1704.2 |
| Asia (Excluding Japan) | 1534.2 | 1544.4 | 1478.9 |
| Type of Source | |||
| Non-Renewable Sources (gas, heavy oil) | 4927.8 | 5065.8 | 4662.4 |
| Renewable Sources (Solar, Thermal Recycle by Used tire) | 138.3 | 2.91 | 0.44 |
| Purchased electricity | 2082.9 | 1963.3 | 1818.8 |
| Reference: Percentage of renewable energy* in purchased electricity | - | 15.6% | 15.7% |
| Purchased Steam | 324.1 | 314.2 | 295.8 |
- * Renewable energy sources can include geothermal, wind, solar, hydro, and biomass.
- **In 2019, the Sendai plant (Toyo Tire Corporation, Japan) converted the factory's thermal energy source from waste tires to natural gas.
(1000t)
| 2018 | 2019 | 2020 | |
|---|---|---|---|
| Tire production volume (new rubber) | 248.6 | 245.6 | 212.3 |
| By Region | |||
| Japan | 134.0 | 130.6 | 108.8 |
| US | 71.4 | 70.1 | 62.2 |
| Asia (Excluding Japan) | 43.2 | 44.9 | 41.4 |
Energy consumption outside of the organization (in Logistics)
| 2018 | 2019 | 2020 | |
|---|---|---|---|
| Raw material/product transportation energy consumption in Japan (1000GJ) | 143.7 | 127.8 | 109.6 |
- *Main efforts to reduce energy consumption: introduce containers and undertake modal shifts (train, and marine transport), and utilize consolidated shipments
Energy intensity
| 2018 | 2019 | 2020 | |
|---|---|---|---|
| Energy consumption /Sales (GJ/million yen) | 19.0 | 19.5 | 19.7 |
Reference: In-house management goals and results
- Goals: Reduce energy consumption per unit of production by at least 1% year-on-year
- Boundary: TOYO TIRE Corp. (Sendai Plant, Kuwana Plant (tire/ Automotive Parts), Hyogo Manufacturing Complex), Fukushima Rubber Co., Ltd., Toyo Soflan Co., Ltd., Ayabe Toyo Rubber Co., Ltd.
- Management unit: By business locations
- FY2020 results: Percentage of sites that achieved the target 14.3%
The case of reducing energy consumption
- Increasing efficiency of energy use by repairing piping and introducing high-efficiency equipment
- Reducing energy consumption by automating operations
- Reducing energy consumption by improving use of air-conditioners and lighting
Reductions in Energy Requirements of Products (Fuel Efficient Tires)
| 2018 | 2019 | 2020 | ||
|---|---|---|---|---|
| Amount of reductions in energy consumption(GJ/㎞) *Estimated values | 186.7 | 169.2 | 253.7 | |
| *Reference: Production ratio of Fuel Efficient Tires | ||||
| Tires for Passenger Vehicles (PCR) | 28.6% | 20.7% | 19.5% | |
| Tires for Trucks and Buses (TBR) | 25.3% | 21.0% | 22.4% | |
※Main Fuel Efficient Tires produced in fiscal 2020:
Tires for Passenger Vehicles (PCR)
- NANO ENERGY0: Obtained the highest grade of “AAA” for rolling resistance. Reduced rolling resistance 40% (compared to traditional products)
- TRANPATH ML: Obtained “AA” grade for rolling resistance for all sizes. Reduced rolling resistance 8% (compared to traditional products)
Tires for Trucks and Buses (TBR)
- NANOENERGY M176: Reduced rolling resistance 9% (compared to traditional products)
- *Rating System Labeling and Fuel Costs:
Tire Fair Trade Council of Japan has found in their testing that a one-step difference in the rating means a 1% difference in fuel cost. For example, our TRANPATH ML has a rolling resistance rating of “AA”. So, it will require 3% less** in fuel costs compared to a tire with “C” rating.
- **The actual savings will vary depending on the vehicle and the way it is driven.
Reduction of Greenhouse Gas (GHG) Emissions
Greenhouse gas (GHG) emissions are said to be the main cause of climate change, and we are working to reduce GHG emissions by making effective use of energy through business activities both in and outside the organization and our products.
Although, energy consumption increase with increasing production volume, we are promoting fuel conversion and equipment renewal at manufacturing bases as a countermeasure to scope 1 and 2.
TOYO TIRE (ZHUCHENG) CO., LTD. successfully reduced their CO2 emissions by approximately 655 tons in fiscal 2020 by introducing energy-saving measures such as changing their cooling water circulator's humidity settings and recycling exhaust steam for heating.
To prepare for Scope 3 emissions, our R&D team is working to reduce CO2 emissions from automobiles by developing fuel-efficient tires, among others.
A calculation of GHG emissions throughout the Group’s value chain based on the Japan Automobile Tyre Manufacturers Association Tyre LCCO2 Calculation Guidelines Ver. 3.0 reveals that GHG emissions during scope 3 category 11 (product use stage) account for at least 80% of overall GHG emissions. We are engaged in efforts to develop fuel efficient tires, and according to the same guidelines, fuel efficient tires can reduce GHG emissions during the use of the tire 95.4 kg CO2e/tire for PCR (Passenger Car Radial) and 879.0 kg CO2e/tire for TBR (Truck and Bus Radial) compared to General Purpose Tires.
GHG emissions
(1000t-CO2e)
| 2018 | 2019 | 2020 | |
|---|---|---|---|
| Direct (Scope 1) GHG emissions | 313.3 | 296.3* | 263.9* |
| By Region | |||
| Japan | 226.1 | 204.7 | 180.7 |
| US | 53.6 | 57.8 | 51.8 |
| Asia (Excluding Japan) | 33.7 | 33.8 | 31.3 |
| Energy indirect (Scope 2) GHG emissions | 313.0 | 294.6* | 271.6* |
| By Region | |||
| Japan | 99.2 | 70.4 | 57.1 |
| US | 86.7 | 91.2 | 86.8 |
| Asia (Excluding Japan) | 127.2 | 133.0 | 127.7 |
| 2018 | 2019 | 2020 | |
|---|---|---|---|
| Other indirect (Scope 3) GHG emissions | 13515.8 | 13626.4 | 12059.8 |
- *Third-party verified data
- **Type of GHG: CO2
| 2018 | 2019 | 2020 | |
|---|---|---|---|
| GHG emissions intensity (Scope 1+2 /Sales (t-CO2/million yen)) | 1.59 | 1.57 | 1.56 |
Reference: In-house management goals and results
- Goals: Reduce CO2 emissions per unit of production 15% compared to fiscal 2005 by December 2019
- Boundary: TOYO TIRE Corp. (Sendai Plant, Kuwana Plant, Hyogo Manufacturing Complex), Fukushima Rubber Co., Ltd.
- Management unit: Scope1+2/production volume(t-CO2/t)
- FY2020 results: 16.6% reduction from FY2005
GHG emissions reduced as a direct result of reduction initiatives in FY 2020
(t-CO2/year)
| Introduced the highly efficient systems (reducing energy consumption): | 153.6 |
|---|---|
| Reducing the energy loss | 6797.0 |
| Change to LED | 319.4 |
| Others | 898.7 |
- ※Type of GHG: CO2
- ※Scope of reduced GHG emissions: Scope 1 & 2
Boundary: in Japan
Emissions of ozone-depleting substances (ODS)
| 2018 | 2019 | 2020 | |
|---|---|---|---|
| Emissions of ozone-depleting substances (ODS) (kg *CFH-11 conversion value) | 0.47 | 0.06 | 0.35 |
- *Type of ODS: HCFC
Nitrogen oxides (NOx), sulfur oxides (SOx), and other significant air emissions(t)
(t)
| 2018 | 2019 | 2020 | |
|---|---|---|---|
| NOx | 324.9 | 183.1 | 141.8 |
| SOx | 5.60 | 3.71 | 2.16 |
| VOC | 719.4 | 573.4 | 560.0 |
Reference: In-house management goals and results
- Goals: Reduce VOC emissions by 50% compared to fiscal 2000 and maintain it.
- Boundary: TOYO TIRE Corp. (Sendai Plant, Kuwana Plant, Hyogo Manufacturing Complex), Fukushima Rubber Co., Ltd., Toyo Soflan Co., Ltd., Ayabe Toyo Rubber Co., Ltd.
- Management unit: VOC emissions
- FY2020 results: 78.0% reduction from FY2000
Assurance:
To ensure the veracity and reliability of data that it discloses, the Toyo Tire Group obtained the independent practitioner’s assurance of the FY2020 environmental data. (As per the procedures of the independent practitioner)
- Scope: The scope of verification is Scope 1 and 2 emissions, energy consumption, water intake and drainage.
- Boundary: 22 sites (1 management, 21 sites of development and manufacture)
* Excluding off-site mobile units
Japan: 12 sites
TOYO TIRE Corp. (Headquarters, Sendai Plant, Kuwana Plant (tire/ Automotive Parts), Hyogo Manufacturing Complex, Tire Technical Center, Automotive Parts Technical Center, Corporate Technology Center, Tire Proving Ground), Fukushima Rubber Co., Ltd., Toyo Soflan Co., Ltd., Ayabe Toyo Rubber Co., Ltd., Orient Machinery Co., Ltd. (Headquarters, Sendai branch)
Americas: 2 sites
TOYO AUTOMOTIVE PARTS (USA), INC.、TOYO TIRE NORTH AMERICA MANUFACTURING INC.
Asia (Excluding Japan): 6 sites
TOYO AUTOMOTIVE PARTS (GUANGZHOU) CO., LTD., TOYO TIRE ZHANGJIAGANG CO., LTD., TOYO TIRE (ZHUCHENG) CO., LTD., SILVERSTONE BERHAD, TOYO TYRE MALAYSIA SDN BHD, TOYO RUBBER CHEMICAL PRODUCTS (THAILAND) LIMITED
・ Period Subject to Report: from 1 January 2020 to 31 December 2020.
・Criteria of Verification: ISO14064-3: 2006 and the SGS verification protocol.
・Verification Organization (a third-party): SGS Japan Inc.
Please click here to read more about verification statement.![]()
Tire Life Cycle Assessment (LCA)
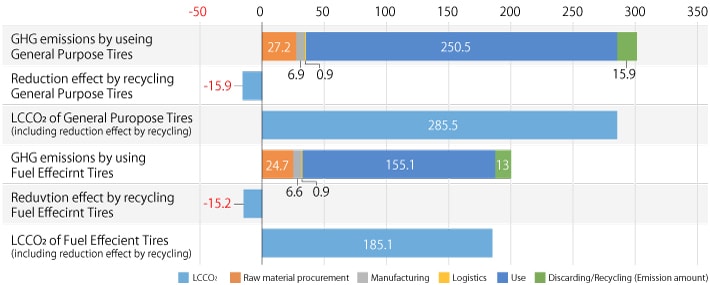
The following are greenhouse gas (GHG) emissions for the life cycle of tires calculated based on Japan Automobile Tyre Manufacturers Association’s Tyre LCCO2 Calculation Guidelines Ver. 2.0. These Guidelines have been developed by referring to standards and systems related to LCA in Japan and abroad (ISO 14044, the Japanese Carbon Footprint system, PAS2050, BPX30-323, and GHG protocol).
[Tires for Passenger Car Radial] Calculation was performed for the most popular tire size (195/65R15).
- General Purpose Tires (per Tire): 300.6 kgCO2e
- Fuel Efficient Tires (per Tire): 243.9 kgCO2e
GHG emissions over the lifecycle of a PCR tire (LCCO2)
[Tires for Truck and Bus Radial] Calculation was performed for the most popular tire size (275/80R22.5).
- General Purpose Tires (per Tire): 2,330.3 kgCO2e
- Fuel Efficient Tires (per Tire): 1,888.1 kgCO2e
GHG emissions over the lifecycle of TBR tire (LCCO2)
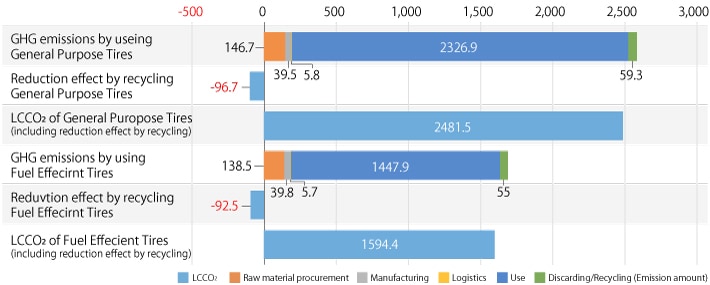
- *GHG emission reduction effects of recycling
For PCR, calculation was performed taking into account the emission reduction effects of thermal use (thermal recycling).
For TBR, calculation was performed taking into account the emission reduction effects of thermal use (thermal recycling), product reuse (retreading), and material reuse (material recycling). - **Reference: Japan Automobile Tyre Manufacturers Association
Sustainability
- Message from the President
- TOYO TIRE Value creation
- TOYO TIRE Sustainability
-
TOYO TIRE Materiality
- Help create a society of sustainable mobility / Support the enjoyment of mobility for all
- Support diverse talent with motivating challenges and job satisfaction
- Continue innovating next-generation mobility technology
- Pursue decarbonization in all corporate activities
- Promote supply chain sustainability
- Ensure the fundamentals of manufacturing: quality and safety
-
ESG Activities
- E: Environment
- S: Upholding human rights
- S: Managing occupational health and safety to global standards
- S: Crisis management (responding resiliently to natural disasters, infections and other crises)
- S: Working with local communities (Helping solve local issues)
- G: Sound governance
- G: Compliance
- G: Risk management
- G: Information security
- G: Promoting digital transformation (borderless and centralized business management through ERP reform)
- External Recognition
- Report Library
- ESG Data
- ESG Data/Survey Index
- GRI Content Index
- Communication on Progress (CoP) Index
- Editorial Policy